
Do you wish to add cool data reports based on charts, graphics, pictograms, or infographics on your website?
Data visualization is the perfect solution that makes it easy to comprehend your report.
Regardless of your online business, data & information are dominant factors for your operations.
If you do not display that data and information correctly, you could be cheating yourself and your stakeholders.
To get the best output, you need a WordPress report builder plugin to display those data elegantly and professionally.
Today, I will introduce you to the 10 Best WordPress Report Builder plugins, which are best for creating a data report with cool charts and graph visualizations.
Plugin | Installs | Rating | Download |
Independent Analytics | 20,000 | ||
Visualizer | 30,000+ | ||
WP Report Builder (By wpDataTables) | 70,000+ | ||
WP Table Builder | 60,000+ | ||
Data Tables Generator | 20,000+ | ||
UberChart | 700+ (Sales) | ||
CM Custom WordPress Reports | 400+ | ||
WP User Frontend Pro | 20,000+ | ||
HubSpot | 300,000+ | ||
amCharts | 3,000+ |
Independent Analytics

An orthodox report builder plugin lets you create a visualization of data and show it to the dedicated person.
Here, Independent Analytics is a report builder plugin that does not require you to create any data manually; rather, it creates them automatically and displays them on your WordPress dashboard in a visually appealing manner.
This GDPR-friendly plugin is designed to be lightweight and user-friendly, ensuring seamless integration with WordPress websites.
With Independent Analytics, users can access crucial metrics such as page views, visitor demographics, and traffic sources, enabling informed decision-making to enhance website optimization. Furthermore, users can back up their analytics and export data to CSV whenever they want.
Independent Analytics provides you with the necessary insights to understand your audience and improve your website’s performance. Give it a try and take control of your website analytics today!
Key Features
- Insightful Analytics Dashboard
- Views and Visitors Metrics
- Shows the Lists of the Top Traffic Sources
- GeoData with Interactive World Map
- User Device Report
- GDPR Compliant Plugin
- Zero Performance Impact on Website
- Lightning Fast Tracking Code
- CSV Export for Views and Referrals
Price: Get the plugin for free. The price of the premium version starts from $99 yearly for a single license.
Visualizer

With the Visualizer WordPress report builder plugin, you can create interactive data on your WordPress site’s pages and posts.
It is the best option to make a visualization report for Finance, Health, Science, Marketing, and Technology.
It allows you to customize every aspect of your report or chart. To create animated tables, charts, and graphs, Visualizer uses Google Visualization API, DataTables.net, and ChartJS.
The interesting fact is that you can use this WordPress report builder plugin for free, and this free version contains 9 awesome chart designs to let you make a report or chart in no time, though you can also start from scratch.
If you consider upgrading this WordPress report plugin to the pro version, it will permit you to import data from WordPress. On top of that, you gain access to the other 6 charts and the front-end editor.
Moreover, you can import data from Google Sheets, Excel, and CSV with this WordPress report builder plugin. It also supports Gutenberg, pagination, search & sorting, etc.
Advantages
- Offers 9 prebuilt chart types
- Offers front-end editor
- Flexible & highly customizable
- Fully responsive chart
- Supports Gutenberg editor
- Import data from other charts, graphs, and tables (Pro)
- Allows users to edit charts (Pro)
- Create private charts (Pro)
Disadvantages
- Data types are limited.
- Data tables are managed separately.
Price: The good news is this WordPress report builder plugin is absolutely free. Download the free version today from the WordPress repository. The cost of the pro version starts from $159/year for a single website.
Report Builder by wpDataTables

Report Builder by wpDataTables is an additional addon that lets you create Word or Excel reports from tables on your website in just one click.
But first, you have to build the templates using wpDataTables on which your reports will be generated. Since the plugin does not feature any settings at all, it lets you prepare your reports with several easy steps.
The interesting part about the addon is that it allows you to generate and download 100 reports in one click. Besides, it also features unlimited front-end inputs that a user can choose from the front-end.
After preparing your reports, you can embed them using a standard WordPress Visual editor or Visual Composer. You can also add custom CSS to match the report elements to your site’s theme.
Advantages
- MS Word and MS Excel report generation
- Unlimited front-end inputs
- Calculate totals
- Bulk report generation in one click
- Easy to insert on pages
- Fully documented
Disadvantages
- This addon works only with the premium version of wpDataTables
Price: Get the addon for $35/year for a single site. The premium version of wpDataTable costs $104/year for a single site.
Data Tables Generator by Supsystic
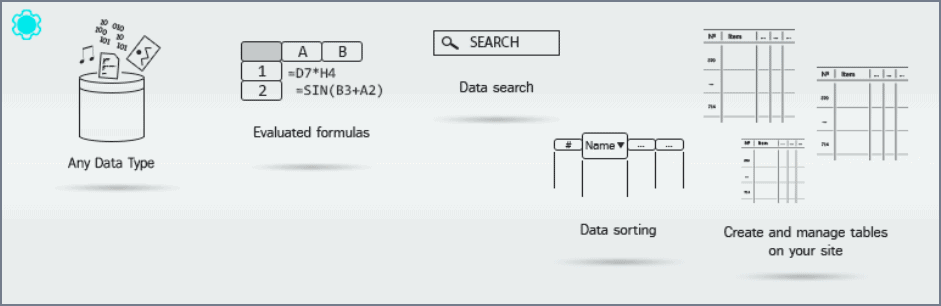
Managing and creating tables, charts, & reports is super easy with Data Tables Generator by Supsystic. It allows you to make your tables and charts responsive automatically, though you can always disable them to adjust table dimensions.
Since different kinds of reports require different types of representation, the plugin provides you with various chart types, such as area charts, line charts, pie charts, bar charts, column charts, and bubble charts.
Moreover, one right-click on any cell will open up more modifying options, such as it can turn the cursor into a resize cursor to adjust the size of rows and columns.
What’s more interesting is that it allows you to insert links, images, or comments. If you want to add formulas, pagination, and search, you would not need other plugins.
The plugin is highly customizable and supports custom CSS. The Pro version enables you to change the font family and gives you front-end edible fields.
Their highlighting pro feature would be the Diagram that turns your tables into any chart format.
Advantages
- Supports formulas and HTML
- Diagrams, charts, and graphs (Pro)
- Support custom CSS
- Availability of title, header, and footer customization
- Choice of loader icon and color
- Best for creating product tables for WooCommerce (Pro)
- Frontend table editing (Pro)
- Database source (Pro)
- Table export and import from CSV, Excel, PDF, and Google Sheets (Pro)
Disadvantages
- Numerous limitations in the free version
Price: Get the free version from the WordPress repository for free. The price of the pro version starts from $49/year for a single site.
UberChart
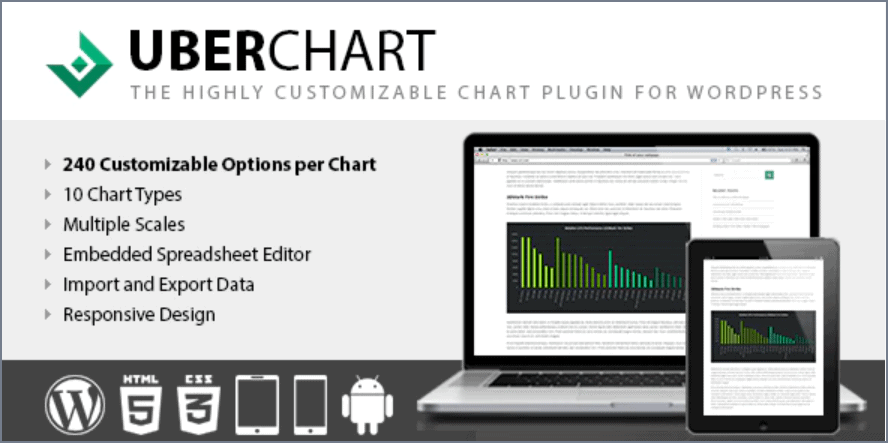
The UberChart WordPress report builder plugin is dedicated to providing you with good-looking reports through their advanced chart solution without any coding knowledge.
This WordPress report builder plugin supports a total of 10 chart types: Line charts, area charts, bar charts, horizontal bar charts, radar charts, polar area charts, pie charts, doughnut charts, scatter graphs, and bubble charts.
You can duplicate any chart you made previously and can modify your created charts. Configuring charts is simple, too.
This WordPress reporting plugin features a back-end spreadsheet editor; on top of that, it also allows you to upload your data directly from Open Office, Excel, and Google Spreadsheets.
The charts and reports you will make using the plugin will be fully responsive; therefore, it will support every modern device display.
For customizing your chart, they have provided tons of styling options. However, the plugin offers you 240 customization options per chart.
It is the best solution for adding visually stunning charts to your blog posts and reports.
You can change whatever you like when making a stunning report with charts and graphs.
You can modify your charts’ color, animations, font size, responsiveness, etc. Moreover, You will have full control over your axis and scales from a data perspective.
Advantages
- Offers 10 different chart types
- Back-end Spreadsheet editor available
- 240 customization options for each chart type
- Highly customizable
- Spreadsheet editor
- Import and export your charts as XML files
- Multi-site ready & Multilingual-ready
Disadvantages
- Tons of customization may overwhelm beginners.
Price: Buy this premium-only plugin from Codecanyon for $39.
CM Custom WordPress Reports

Last but not least, we have another great WordPress report builder plugin that comes with 20 custom reports and several graph types.
Using CM Custom WordPress Reports, you can make interesting reports, including graphs & charts, and mail the user periodically. You can even set the email list and create a schedule to send the mail automatically after the report generation.
These reports can also be exported as a CSV or PDF that you can analyze and compare to see the progression.
The graphs and charts are customizable, and you get to choose which field you want to display.
Advantages
- 20 custom reports type
- 4 graph types
- Report export options
- Scheduling reports sending the users
- Email templates
- Report dashboard
Disadvantages
- The free version is pretty limited
Price: The price of this premium WordPress Custom report plugin is $29 for a single site. This plugin also features a free version that is not that much handy when compared to the premium version.
WP User Frontend Pro

WP User Frontend Pro isn’t exactly a report builder plugin. Rather, it’s a complete package for your WordPress front-end solution.
It comes with superb features like menu and content restriction, profile management, subscription-based posting, membership, and user directory builder.
So, WP User Frontend Pro offers all you need to take control of your website’s content and users.
Indeed, it has a dedicated module for reports. It will help you to watch and analyze detailed data and insights on all the important aspects of your website.
The Reports module installs a new menu in your WordPress dashboard so that site admins can view real-time reports on transactions, subscriptions, posts, and users.
View your data in the form of colorful bars and pie charts, and see comparisons between the numbers of different posts, admins and sellers, sold and pending transactions, and total sales, taxes, and net income.
Advantages
- Drag and drop frontend customizer
- Dedicated Reports module
- Global option for disabling post edit on account
- Read-only option for custom field
- Admin dashboard news and update meta-box
- Multiple WordPress integrations
Disadvantages
- It’s not a single Report builder plugin
Price: You can download the plugin for free. The pro version starts at $49 for a single site.
HubSpot

HubSpot is one of the most famous WordPress business plugins that has brought several business features under one hood.
It is not a WordPress report builder plugin but offers various analytics and reporting features. It lets you gain insights into your website’s performance, user behavior, engagement, and other valuable metrics.
It offers you a range of reports, such as your website’s performance reports, conversion reports, visitor reports, lead generation reports, traffic reports, and any other custom report that suits your specific needs.
The impressive fact about HubSpot is that it allows users to view all necessary data from multiple sources in a single dashboard.
Therefore, users can quickly analyze the data and gain valuable insights into website performance.
Advantages
- Provides All Business Tools Under One Hood
- Advanced Analytics
- Can See Analytics in the Dashboard
- Offers Various Types of Reports & Analytics
- Email Marketing Tools
- Marketing Automation
- Popup Builder
- A/B Split Testing
Disadvantages
- Not a dedicated report builder plugin.
Price: Get the free version from the WordPress repository. The pro version offers you more advanced functionalities, and the minimum cost is $18 monthly for a single website.
amCharts

Did you ever try adding Javascript content to your WordPress pages or posts? I know, it’s impossible because WordPress detaches all the Javascript.
With the amCharts WordPress report builder plugin, you can add javascript maps and charts to your WordPress posts and pages effortlessly, which was a hassle earlier.
Moreover, you can also use the built-in PHP function to place your chart and reports anywhere in your report.
It is best for advanced users rather than beginners. There is one noticeable fact that this report builder does not provide any visual editor.
All you need is to create a shortcode and insert it on the page to add your post’s javascript content.
This advanced report builder comes with 9 built-in charts, and they are XY charts, Sankey diagrams, radar charts, gauge charts, chord diagrams, treemaps, and maps.
For each type of chart, you are allowed to define the default javascript resources libraries.
Advantages
- Provided uncommon charts
- Has flexibility while customizing codes
- Defaults provided
- Good for advanced users
- Free to use
Disadvantage
- Unavailability of the visual editor
- Documentation is very little
- Not for beginners
Price: Download this reporting plugin for WordPress for free. Try the pro version for $180 if you are an advanced user
Conclusion
If you have not decided yet which WordPress report builder plugin you should choose, let me break it down for you, though I have discussed those above.
To help you make this decision, here is an overview of what builder to choose for what purpose.
If you want
A great Report Builder that is based on charts and graphs
You can choose Visualizer, which is a great table builder, along with a report builder that is based on charts and graphs. It’s more than just a report builder. Besides making charts and graphs, you can make cool tables of your product to highlight the product features to get a handsome remuneration.
A Report builder plugin with tons of customization
If you like tons of customization, you should go for the UberChart WordPress report builder plugin, which provides 240 customization options for each chart type.
Unlimited Pro Level customization and data formats
You should choose wpDataTables or Data Table Generator by Supsystic if you wish to have unlimited pro-level customization and different data formats.
An advanced report builder, and you are an advanced user.
AmCharts is the plugin that you would like if only you were an advanced user. But if you are a beginner, you should avoid using it.
I hope that by now you have made your decision about choosing one for your website. I would urge you to try each of the mentioned WordPress report builder plugins if you would like to discover more. You will be more amused after using them all by yourself.
If you have enjoyed this post, please share it with your friends and family. We have also covered lots of WordPress plugins that you might need for your website. Feel free to check them out below.
Recommended Reading:
Affiliate Disclosure: This post contains affiliate links. That means if you make a purchase using any of these links, we will get a small commission without any extra cost to you. Thanks for your support.