
If you need to show charts and other info on your site, then pictures can be a good option. But there are some huge drawbacks. Static images can take up storage space and may affect page load time, especially when they’re large or not optimized. So, what’s the solution?
It’s easy: Data visualization charts plugins. With this kind of plugin, it’s easier to make charts. All you need to do is to feed the plugin with data, and the plugin will do the rest. And in case of any correction, you don’t need to take down the entire dataset to re-edit and re-upload it. Just make some tweaks, and you are done.
So, which plugin would be the best fit for your needs? To find out, you don’t need to roam around the market anymore, cause we’ve made the list of the 10+ Best WordPress Charts Plugins for Data Visualization.
Plugin | Active Installs | Ratings | Download |
Charity | 4,000+ | ; | |
Visualizer | 20,000+ | ; | |
Data Tables Generator | 20,000+ | ; | |
Ultimate Blocks | 50,000+ | ; | |
Tableberg | 2,000+ | ; | |
UberChart | 700+ | ; | |
wpDataTables | 70,000+ | ; | |
Ninja Charts | 3,000+ | ; | |
Chart Widget for Elementor | 800,000+ | ; | |
Elegant Chart | 300+ | ; | |
amCharts | 2,000+ | ; |
Now let’s learn more about these plugins.
1. Chartify
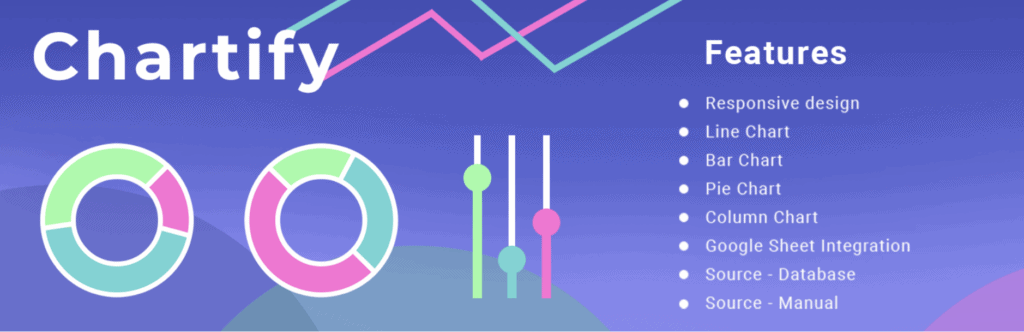
Chartify is a versatile plugin that makes creating charts an easy task. You can use a variety of data sources, whether it’s by manually adding your data, importing it from a CSV file, connecting to Google Spreadsheets, or even querying your preferred database.
The best part is that these charts are dynamic. When you connect to your Google Sheets account, the charts automatically adjust whenever you add or change data in your spreadsheets. You can easily link your chart data with Google Sheets, ensuring that your charts stay up-to-date without requiring any coding skills.
If you’re looking to represent comparisons over time or display frequency distributions, the SQL Builder for DB Queries feature is available, although it may require some development skills.
For those who prefer working with manual data, you can extract insights from existing data and share them with your website visitors, making your content more engaging and interactive. And if you have data stored in CSV files, you can effortlessly import it to build eye-catching charts and graphs. Chart Builder simplifies the process of chart creation by offering a range of data sources and automatic updates, making it a valuable tool for both beginners and more advanced users with the help of the various chart types.
2. Visualizer

If you want to make tables and charts that are adaptive, responsive, and fully adjustable, and which also can be edited in-post with an Excel-like editor, or can be imported from an existing database, then the very first pick of our list could be the best choice for you. Visualizer is an easy-to-use and reliable WordPress charts plugin, with 40K+ active installations.
This plugin offers multiple chart types for displaying data in WordPress. The plugin supports 15 chart types through Google Charts and Chart.js, including line, bar, pie, and table charts; verify current free-version availability before publishing.
Since the charting solution is built entirely on HTML5/SVG/VML, no additional plugins are necessary to view the data. You can easily integrate these charts into your site with just a few clicks. Additionally, schedules can be made to automatically update your charts from your online storage (CSV, Google Sheets), databases, or third-party APIs.
Another important feature that this plugin offers is the freedom of customization. To ensure that your website’s appearance is consistent overall, you can customize a wide variety of settings. You can use Google Chart Tools with the default configuration; making changes to the default configuration is completely optional. If the design of your website deviated from the settings, you can easily make adjustments to the charts and graphs. An array of controls for modifying the design of each chart are made available.
Key Features
- Guttenberg support.
- A customizable permissions system allows visitors to edit charts.
- Automatic data synchronization feature.
- Instant advanced table.
- Customizable and interactive charts.
Price
The free version of Visualizer offers the basic features of the plugin. If you want to get access to the premium features, you need to get the Visualizer Pro. There are 3 annual plans, costing $99, $199, and $399.
3. Data Tables Generator
If you want a lightweight and fast responsive plugin for making data tables, then this plugin is the one you are looking for. You can quickly and easily post data tables online, and design them any way you want, with just a few clicks. This table generator allows you to construct tables with an endless number of rows and columns. Plus, your data and tables will look great, thanks to the table chart maker features it offers. With 30,000+ active installations and 400+ five-star ratings, Data Tables Generator appears to be a popular option.
The front-end editing feature of this plugin will allow you to edit individual fields for users in a table. Just click on the cell you want to edit, enter the data, and that will be saved automatically, saving you time and effort. And you can also track logged-in users’ editable drop-down list results. Formulas can also be used in the drop-down lists.
Another amazing feature of this plugin is the responsive mode. By dynamically incorporating and removing columns from tables, you can optimize the layouts to work well across a wide range of screen sizes. This will enable you to make your tables not only work according to your requirements but also attractive to visitors.
Another essential component this plugin offers is the sorting feature. This feature will allow you to sort data rows on the client side, without any complex settings, and it’ll take just a few clicks. If you are a user of big tables, this feature will come in very handy for you and will make it easy to find out data from big amounts of rows and columns.
Key Features
- Search, Sorting, Filters, and Pagination features.
- Features table import and export from CSV, Excel, PDF, and Google Sheets.
- Server-side processing technology.
- HTML & Formula support.
- Can be used in 15 different languages.
Price
The base version of the Data Table Generator is completely free. But if you want to get access to advanced features like Database support or front-end editing, you have to buy the pro version. There are 3 types of packs available for purchasing, each of which has annual, 2-year, and 3 years deals. The personal pack will cost you $46 annually, $59 for 2 years of usage, and $79 for 3 years license. The developer option will cost you $69, $109, & $149 respectively. And the enterprise deal is priced at $149, $239, & $319.
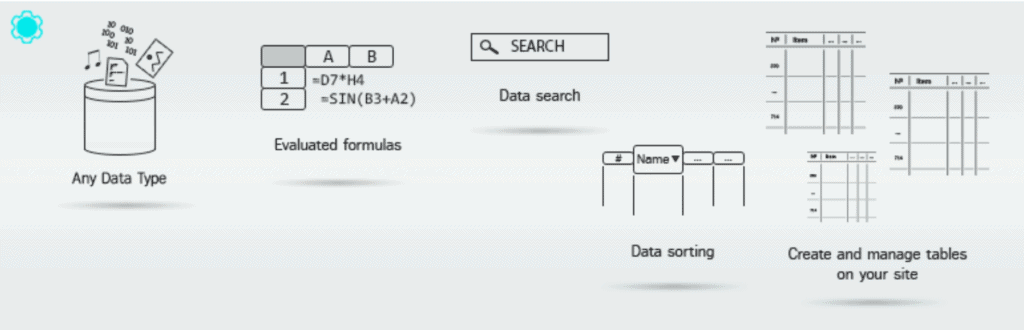
4. Ultimate Blocks
Ultimate Blocks is a comprehensive WordPress plugin tailored for bloggers and content marketers. It offers a suite of over 25 blocks designed to enhance the Block editor and elevate website user engagement. This plugin is celebrated for its simplicity and functionality. It provides users with a versatile toolkit for crafting engaging and visually appealing content without the complexity often associated with advanced content creation tools.
Ultimate Blocks include a Progress Bar, Counter, and Timeline blocks, which are particularly useful for data visualization.
The Progress Bar block allows for the visualization of progress in various contexts, such as skill levels or project completion stages, with customizable styles, descriptions, thickness, and color.
The Counter block offers dynamic number displays, ideal for showcasing statistics or achievements in an interactive manner.
The Timeline block enables users to create chronological narratives or event sequences, adding depth to storytelling on websites.
Ultimate Blocks stands out not only for its rich feature set but also for its user-friendly approach to content creation. It provides a seamless experience for WordPress users, enabling them to enhance their posts and pages with advanced functionalities without needing extensive technical knowledge.
Praised for its utility and ease of use, Ultimate Blocks has garnered positive feedback from the WordPress community, reflecting its reliability and effectiveness as a content enhancement tool. With over 50,000 active installations and high user ratings, it represents a trusted solution for those looking to add sophisticated blocks to their WordPress sites effortlessly.
Key Features
- 25+ Custom Gutenberg Blocks
- Easy to Use
- SEO-Friendly
- Optimized for Speed
- Multipurpose
Price
It’s a freemium plugin. The pro version starts at $49 for a single website.
5. Tableberg
Tableberg is a dynamic WordPress plugin designed to enhance data visualization on your website with the ease and flexibility of the Gutenberg editor. Perfect for bloggers, businesses, and educational websites, Tableberg enables users to create responsive and beautiful tables directly within WordPress posts and pages. This plugin is ideal for presenting complex data, such as statistical information, financial data, survey results, or product comparisons, in a more digestible form.
With Tableberg, you can effortlessly transform raw data into visually appealing tables and charts, customized to match your site’s design and branding. Whether you’re looking to display pie charts, line graphs, bar charts, or simple data tables, Tableberg provides a user-friendly interface that requires no coding skills, making it accessible for all WordPress users.
Key features include table-building tools inside the block editor and customization options for colors, fonts, and layouts; confirm any import or real-time sync features before listing them. Moreover, Tableberg’s charts and tables are fully responsive, ensuring that your data looks great on all devices, from desktops to smartphones.
By incorporating Tableberg into your WordPress site, you’re not just enhancing the visual presentation of your data; you’re also improving user engagement and comprehension, making your content more impactful and memorable. Whether for educational content, business reports, or engaging blog posts, Tableberg is an essential tool for anyone looking to elevate their data visualization capabilities on WordPress.
Key Features
- Built for Block Editor
- Sub-blocks (Image, List, Button)
- User-Friendly
- SEO Friendly
- Speed Optimized
Price
It’s a free plugin. You can download it from the WordPress repository.
6. UberChart
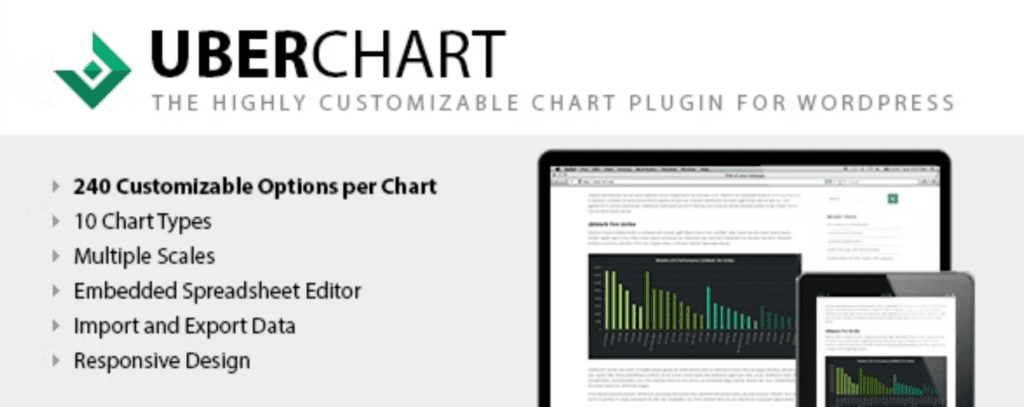
If customizability is your first priority over any other features, then UberChart is the best WordPress chart plugin you can get for your money. Using this plugin, you will have the power to create a wide variety of charts, which will be highly customizable in a number of different ways. So, you can now go over and beyond when designing a chart, and data visualization are now easier than ever.
Customizing is the key feature of this plugin. You can bend and tweak your charts in any way you like, and you have absolute freedom over personalization. There are 10 different types of charts and 240+ customization options per chart. Not only that but for every dataset, there are 30 customization options. Additionally, there are 30+ ready-to-use templates, which can be used to make charts easily, in under minutes.
And if you don’t want to manually do all the hard work, this plugin got you covered there too. You can easily import datasets and charts from external hosts or can move your charts from your website to other sites. You can also archive your charts as XML files, so backing up files is now easier than ever.
Multisite support and a spreadsheet editor are two other big pluses of this plugin. This plugin supports single activations, network activations, or activations on single sub-sites of the network. You can also save time by copying your data directly from your preferred online spreadsheet editor (such as Microsoft Excel, LibreOffice, Google Sheets, OpenOffice, etc.) into the embedded spreadsheet editor in UberChart, and vice versa. This will allow you to transfer your data quickly and easily.
Key Features
- Highly Customizable.
- Supports linear, logarithmic, time, and category scales.
- Colors, padding, margins, and radius options are available.
- Multi-language functionality and cross-browser compatibility.
- Charts can be previewed directly in the back-end menu.
Price
Probably the only backlash UberCharts got is the lack of free versions for users. If you want to use this plugin, you need to buy it. The regular license price for this plugin is $39. And if you need the extended license, it will cost you $195.
7. wpDataTables
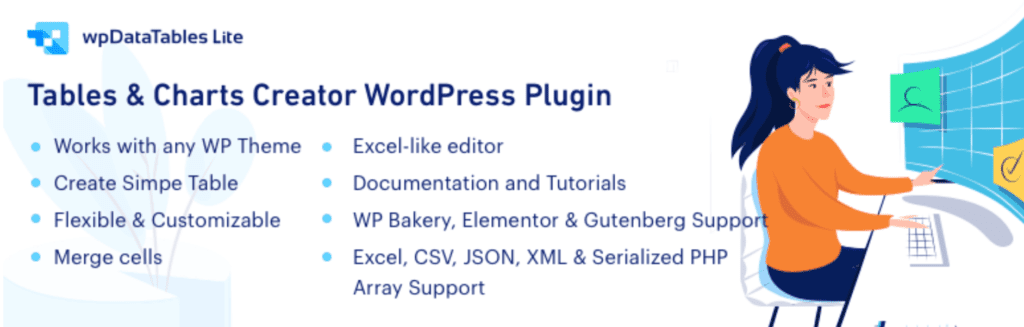
If you are new to data visualization, & don’t know much about how to do what, or simply just want an easy solution for your work, then wpDataTables is the perfect WordPress chart plugin for you. Easy to use, simple to understand, and yet responsive- these are the features if you sum up the plugin. With 60K+ active downloads and 200+ five stars reviews, this plugin is a reliable tool for the job.
This plugin has so many features to make creating fine-tuned charts easy for you. Among those, one of the notable features is the responsive tables feature. In simple words, the same chart will respond and will show differently on laptops, smartphones, or tablets. You can choose to hide/show tables based on the device the chart is shown on, which can be shown/hidden with a dropdown button, giving your charts a more creative look.
The array of sources you can use to make charts with this plugin is another amazing feature of this wpDataTables. You can choose from any source you want- Excel, JSON, CSV, XML. Whatever source you choose, it will be very easily integrated with the plugin. You can also use HighCharts, Chart.js, or Google Charts rendering engines, which are compatible with this plugin to create dynamic charts.
The new grouping feature is another noteworthy element. It is very useful, as the values of the rows with the same label will be summed up, and rendered as a single series. So you don’t have to manually pick up and compile it, the plugin will take of it, making the job easier for you.
Key Features
- Responsive design and conditional formatting.
- Multiple DB engine connections support.
- Elementor, Gutenberg, Avada, & Divi integration.
- MySQL-query-based tables support.
- Pre-filtering tables through URL.
Price
The lite version of wpDataTable is free to use. To get access to the premium features, you have to buy from the 3 packages they offer, which come in annual and lifetime plans. The basic plan will cost $69/per year and $199 for a lifetime. Similarly, the pro plan will cost $109/year and $389 for a lifetime, and the developer plan is priced at $249 and $589 for a lifetime.
8. Ninja Charts

If you want a lightweight plugin, which will not create any extra loads on your WordPress site, or won’t affect the loading time, and also get the job done well, then you got just the right plugin. Marketed as a lightweight WordPress chart plugin, Ninja Charts could be a worthwhile option to consider. Using this, you can create amazing charts in different formats in just some simple steps.
The best aspect of Ninja Charts is the flexibility it provides, even after being a feathery plugin. It gives you the ability to customize the data chart in the best way possible. With the help of 9 different styles of charts, it will give you the freedom to adjust data charts per your requirements for visual presentations.
Another big feature of this plugin is the ease of use it offers. Its interface is very easy to use, and getting started is very simple. The steps to get started are really handy and simple to grasp. You can also use shortcodes to generate charts. You can even create charts with drag-and-drop gestures.
The fact that it works by default with Ninja Tables is another significant advantage of this plugin. You’ll be able to retrieve data from the Ninja Tables plugin and use it to build charts with the help of this WordPress chart plugin. And not only that, you can run both of them simultaneously.
Key Features
- 11 types of chart js charts & 10 types of google charts.
- Versatile rendering engines.
- Special formatting and preview option.
- Amazing dedicated support facility.
- Responsive & mobile-friendly WordPress chart plugin.
Price
The price could be described as another notable feature of Ninja Chart, as it is free to use. You don’t need to pay any money to use this amazing plugin.
9. Chart Widget for Elementor
This plugin is aimed at Elementor users who want to visualize data with a range of chart types. Keeping Elementor users on the main focus, Chart Widget for Elementor is a powerful plugin to create eye-catching charts and graphs.
This plugin is especially suitable for newcomers, as it has a drag-and-drop feature. So, you don’t need to learn any kind of new technical skills to put a chart into your post. The work has been made easier for you, all you need to use is your mouse to click, drag, and drop charts.
And if you need something more complex, like a radar chart for showing multiple data points and the variation between them, then this plugin got you covered there too. Using this, you can display labels on the right side of the radar charts and make it more pleasing for your visitors.
You can display data visually on your site using Chart Widget for Elementor; verify whether real-time updates are supported in your setup. So users can now easily understand large amounts of data and the relation between them. This is especially helpful if your site depends on the content that needs real-time updates.
Key Feature
- Allows adding multiple animations & comparison between different quantitative variables motion effects.
- Multiple colorful pie chart designs.
- Tons of customization options.
- Easy to use, even for amateurs.
- Specially built for Elementor users.
Price
This plugin is a bit costly. To use Chart Widget for Elementor, you need to buy the Whole ElementsKit, which starts at $39 to $179, for yearly subscriptions. Lifetime packs start at $119 to $489.
10. Elegant Chart
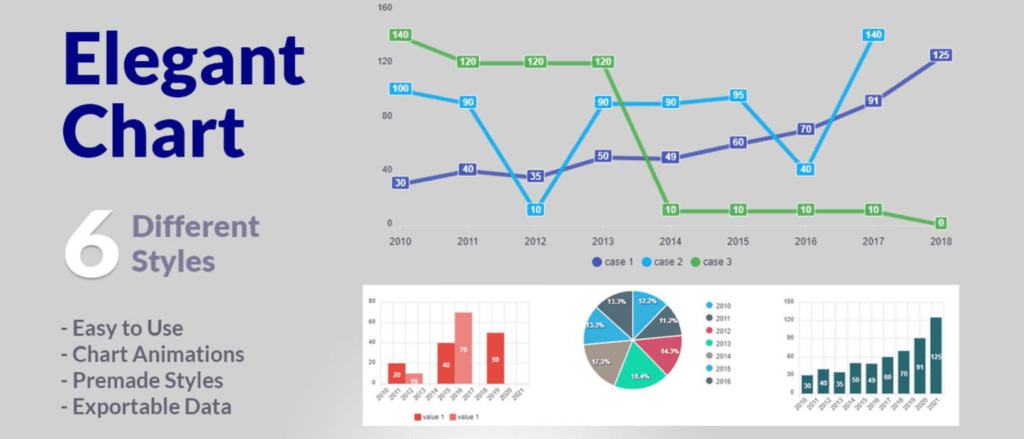
And for our last pick of the list, we brought you a cutting-edge charts plugin that enables web designers to generate captivating data visualizations for their sites. And if you are a Divi user, then Elegant Chart is a must-to-check item for you, as this plugin is the first advanced Divi plugin that helps you to create any kind of chart with different customization options.
Performance is the biggest feature of this plugin. You can feed it with any amount of data set, and yet, it will not slow down your site loading time. This will come in very handy when you need to show a lot of data charts at once or need to show multiple graphical charts.
Loading animation is an important aspect of charts, which many of the site owners overlook. Elegant Charts provides one of the smoothest chart-loading animations, which makes that more eye-pleasing to visitors. With the help of this feature, you can retain more users, and create the potential of returning them to visit sites.
Interactivity is another great and notable feature of this plugin. When the user moves their cursor over individual data points, it displays helpful tooltips. Every one of these alternatives contributes to a clearer and more efficient transmission of data.
Key Features
- 6 Charts Types.
- Allows you to export your charts as SVG, PNG, or CSV.
- Lots of customization options.
- Supports Multiple Data Sets.
- High-performing and interactive interface.
Price
Unfortunately, Elegant Charts is not free. You have to pay $15 for it, with 1 year of updates and support, and can be used on unlimited sites.
11. amCharts

If you are in need of displaying complex charts, then amCharts can be the WordPress charts plugin you are looking for data visualization. This plugin is a very powerful tool to deliver you exactly the result you want, in the way you want. With the help of the vast library, it provides for data visualization, you don’t even need to learn about anything new. With the power and flexibility amCharts provides, you can now get your work done more efficiently.
If you have a WordPress site but need to insert JavaScript content in your posts, then you are in real trouble. Because it’s impossible, as WordPress erases all the JavaScript content. So, including any JavaScript chart on your site is a big hassle, if not impossible. But with the help of this plugin, this problem is solved by allowing you to create chart code snippets, which can be inserted into the posts or pages as a shortcode.
Another very important feature it offers is fast data processing. It is designed to be as efficient as possible, with focusing on lessening the pressure on system memory and the overall system. With lightweight data objects and updates, this feature is implemented in a very fine way.
Speaking of lightweight, the size and speed of this plugin are another notable features. Due to its lightweight approach to data parsing and rendering, amCharts is capable of running a handful of charts on the same page, without slowing down the browser. Which is very helpful in cases of processing a lot of tables simultaneously.
Key features
- Easy switching between CDN-hosted or local chart libraries storage, and automatically locating installed libraries and available resources.
- Multiple datasets and data comparison features.
- Universal rendering engine.
- 100% JavaScript support.
- Fast, lightweight, and powerful, for all kinds of charts.
Price
Probably the best reason for getting the amCharts plugin is its price. You can use it for free. All the advanced features are completely free. However, the free version will show a small amCharts logo in the corner of your charts. If you don’t want that, you can use any of the 4 packages the creators of this plugin offers: Single website license for $180, Single App or SaaS website license for $1200, OEM license for $2975, & Extended OEM license for $8925. All the packages need to be bought only once, so no annual renewal is needed.
Bonus: WP Table Builder
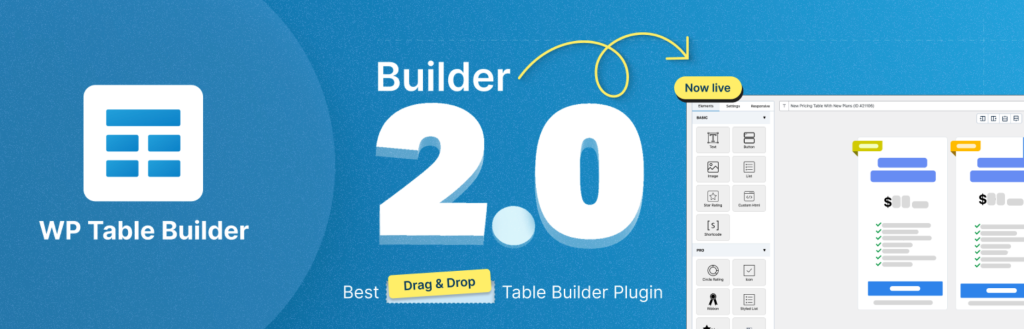
WP Table Builder is a visual table builder that helps you create responsive comparison, pricing, and product tables without writing code. Using its drag‑and‑drop editor, you can place text, images, lists, buttons, star ratings, and even shortcodes into any cell. Import CSV or XML files, merge or split cells, and embed tables anywhere using shortcodes.
The plugin provides pre‑built templates, sticky headers, and customizable borders and colors, and the Pro version adds advanced features such as pagination, searchable tables, lazy loading, and tooltip/highlight effects.
If you need elegant product comparison or pricing tables, WP Table Builder’s user‑friendly interface and responsive design make it a compelling choice for bloggers and affiliate marketers. The core plugin is free; Pro plans start at around US$59 per year or US$179 for a lifetime license.
Conclusion
Businesses rely heavily on visual representations of data. The visual appeal and user engagement of your site will greatly benefit from the addition of data visualization. So, here are 11 WordPress plugins for creating charts and visualizing data. The given resources give you a wide range of choices for incorporating WordPress data visualization into your site’s design. We hope you will find the best solution for you and get the job done easily. Best of Luck!
Disclosure: This post contains affiliate links. That means if you make a purchase using any of these links, we will get a small commission without any extra cost to you.
Leave a Reply
You must be logged in to post a comment.