AI tools like Google AI Overviews, ChatGPT, and Perplexity AI are changing how people discover content. Many readers no longer click ten links to compare tools. They ask a question and expect a clear answer. These systems scan blog posts, extract key facts, and build short summaries.
If your content is not structured clearly, it becomes harder for them to understand and reuse. Becoming LLM-friendly is not about adding AI keywords or writing for machines. Large language models look for entities, features, comparisons, limits, and relationships.
When those details are hidden inside long paragraphs, extraction becomes risky. The more mixed your writing is, the harder it is to summarize safely. Tables separate facts from opinions. They show relationships directly and make comparisons easy to scan.
So, in this post, we will explore in detail how tables improve structure, reduce ambiguity, and help both readers and AI systems understand your content better.
How LLMs Actually Consume Blog Content

Large Language Models do not read like humans. They do not enjoy storytelling. They do not follow emotional flow. They do not care about your writing style. Instead, they break your content into small pieces of information. They try to understand how those pieces connect.
When an AI system scans a blog post, it mainly does three things. They are mentioned below.
| What the Model Looks For | What It Means in Simple Terms |
|---|---|
| Entities | Names of products, plugins, tools, features |
| Relationships | Who supports what, which tool is better, what includes what |
| Extractable facts | Prices, limits, compatibility, numbers, clear statements |
The model then compresses these pieces into a short answer. That answer might appear in search summaries or AI-generated responses.
Why Long Paragraphs Create Problems
A single paragraph often mixes opinions, conditions, exceptions, comparisons, and personal recommendations. For a human reader, this can feel natural. But for AI systems, it creates uncertainty. Here is a simple example:
Paragraph Version
Plugin A is great for advanced users and supports many powerful features, although beginners may find it complex. Plugin B is easier to use but lacks some advanced functionality, which might matter for larger websites.
Verdict – For a human, this is clear enough. But for an AI system, the relationships are not perfectly separated.

Table Version
Now, look at the structured version in the table below.
| Plugin | Beginner Friendly | Advanced Features |
|---|---|---|
| Plugin A | No | Yes |
| Plugin B | Yes | No |
Verdict – There is no guessing here. The relationships are clearly declared.
Why Tables Work Better
A table forces you to organize information in a fixed structure. It uses three clear layers to reduce ambiguity. They are Rows, Columns, and Cells. Let’s see how they work:
| Table Element | What It Represents | Example |
|---|---|---|
| Rows | Entities | Plugins, plans, tools |
| Columns | Attributes | Price, features, limits |
| Cells | Factual values | $49/year, Yes, 10 users |
This creates structure by default. There is no confusion about what belongs where. But in normal text, relationships are often implied.
That difference matters. When AI systems generate summaries for tools like Google AI Overviews or platforms like ChatGPT, they prefer information that feels low-risk and clearly structured. Tables naturally provide that structure.
Learn how to create tables in WordPress.
A Real-World Example: List Posts vs Categorized Tables

Let’s look at a very common blogging format. Suppose you publish a post titled – 10 Best WordPress Plugins for X. Inside the article, you describe each plugin in 2–4 paragraphs. Each discussion about the plugin covers the following points
- Different use cases
- Different strengths
- Different limitations.
At first, your discussion may feel complete as you have covered everything. But structurally, everything blends together. Explore tips to make your WordPress tables convert people.
The Problem With Long Listicle Posts
In paragraph format, listicle blog posts often create three types of issues. They are:
| Problem | What Happens |
|---|---|
| Mixed audiences | Beginners and advanced users are discussed together |
| Unclear comparisons | Strengths are described, but not aligned side by side |
| Difficult summarization | Features are scattered across paragraphs |
Now imagine an AI system scanning your article. It tries to answer the following questions:
- Which plugin is best for beginners?
- Which plugin supports feature X?
- Which plugin works with WooCommerce?
But the relationships are not declared clearly in the text paragraphs. They are hidden inside the narrative text. Here’s what a typical paragraph-style entry looks like:
Plugin A is powerful and flexible. It works well for advanced users and supports WooCommerce. However, beginners may find it slightly complex at first.
For humans, this is readable. But for AI systems, the signals are mixed. The model has to interpret the meaning, which increases uncertainty.
What Changes When You Add Categorized Tables
Now imagine reorganizing the same plugins into clear groups. Instead of one long list, you create separate tables. For example,
Table 1: Best Plugins for Beginners
| Plugin | Beginner Friendly | Setup Difficulty |
|---|---|---|
| Plugin B | Yes | Easy |
| Plugin C | Yes | Very Easy |
Table 2: Best Plugins for WooCommerce
| Plugin | WooCommerce Support | Advanced Features |
|---|---|---|
| Plugin A | Yes | Yes |
| Plugin D | Yes | Moderate |
Table 3: Best Plugins for Comparison Features
| Plugin | Comparison Tool | Customization Level |
|---|---|---|
| Plugin E | Yes | High |
| Plugin F | Yes | Medium |
Each table answers one clear question. This structure highlights the key information separately instead of blending them altogether. AI systems feel more confident extracting structured groups than interpreting mixed paragraphs. Humans also benefit as they don’t need to read the entire post.
Types of Tables That Make Posts More LLM-Friendly
Not all tables improve clarity in the same way. Some table formats are especially effective when your goal is to make content easy to extract, summarize, and reuse. The difference is not visual design. The difference is in structure.
The best tables clearly define entities, attributes, and values without mixing them. Below are the table types that work best.
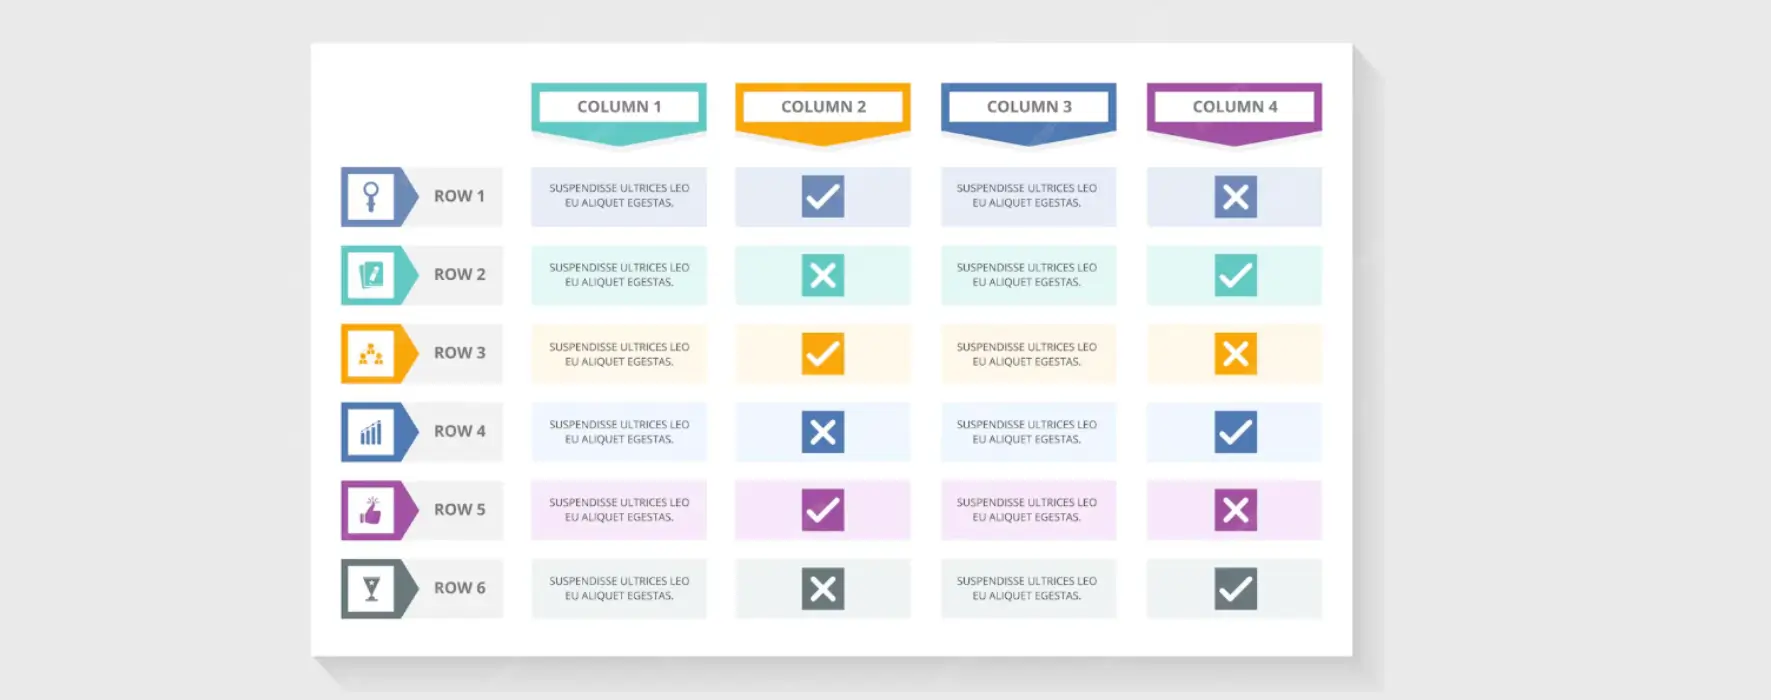
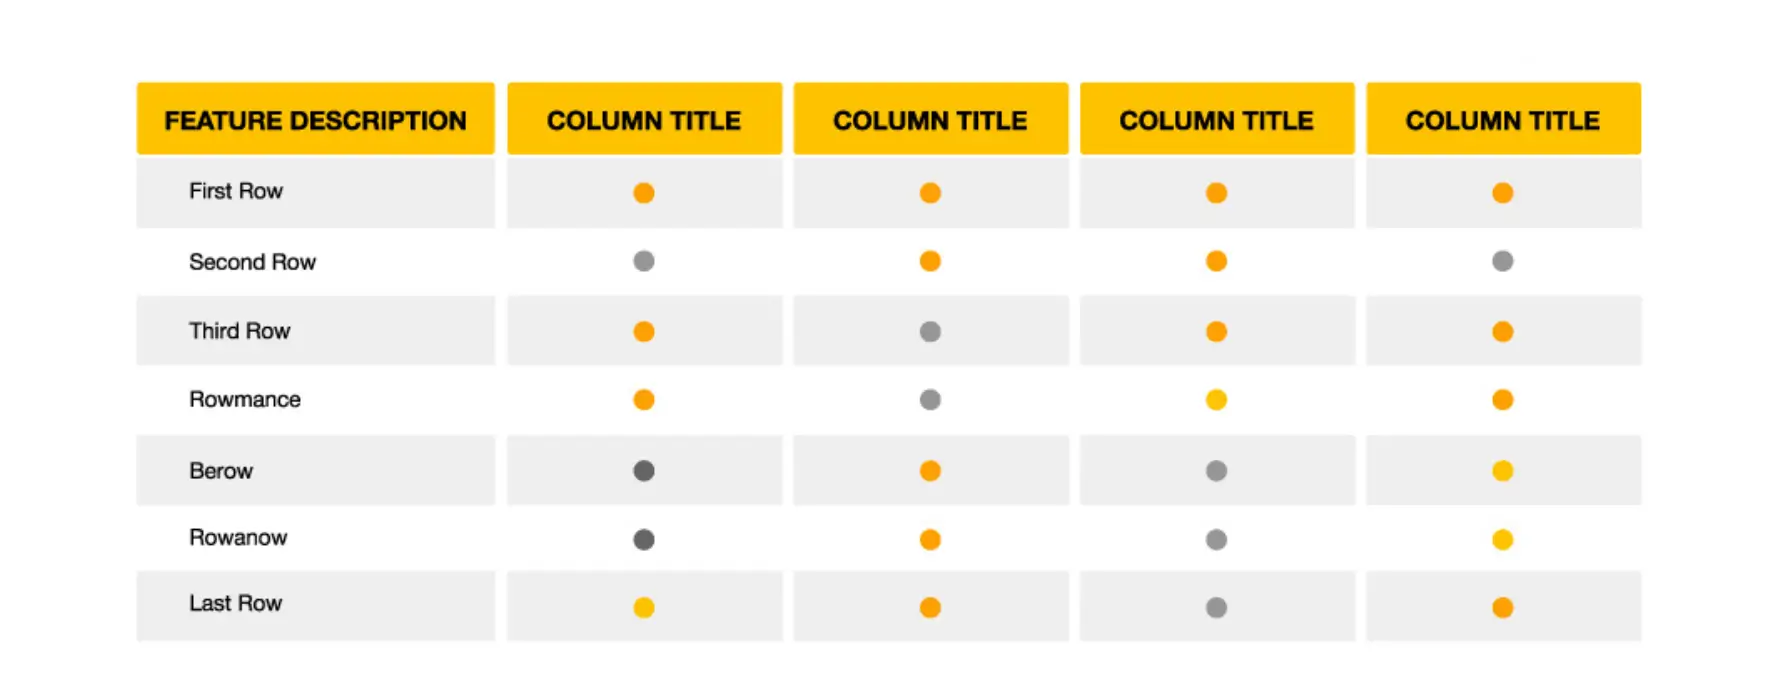
Type 01. Feature Comparison Tables
A feature comparison table places tools, plugins, plans, or services in rows and lists features in columns. Each cell shows whether that feature is available or not. This format is best for presenting and discussing:
- SaaS tools
- WordPress plugins
- Free vs Pro comparisons
It clearly shows:
- What is included
- What is missing
- Where upgrades make a difference
Because each feature is aligned side by side, AI systems do not need to interpret descriptive language. They simply match the feature name with the value in the cell. This reduces confusion and improves summarization accuracy.
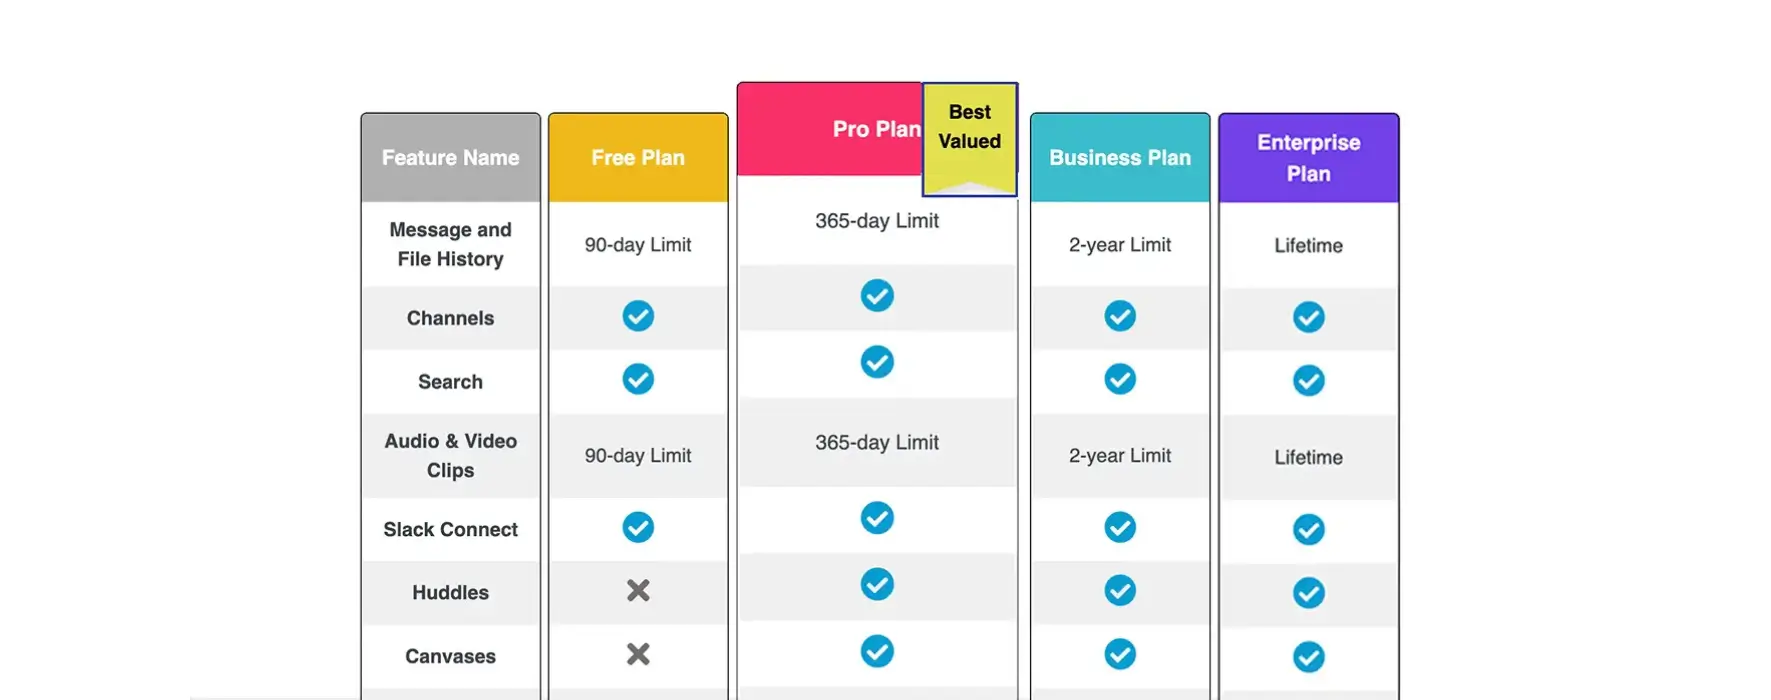
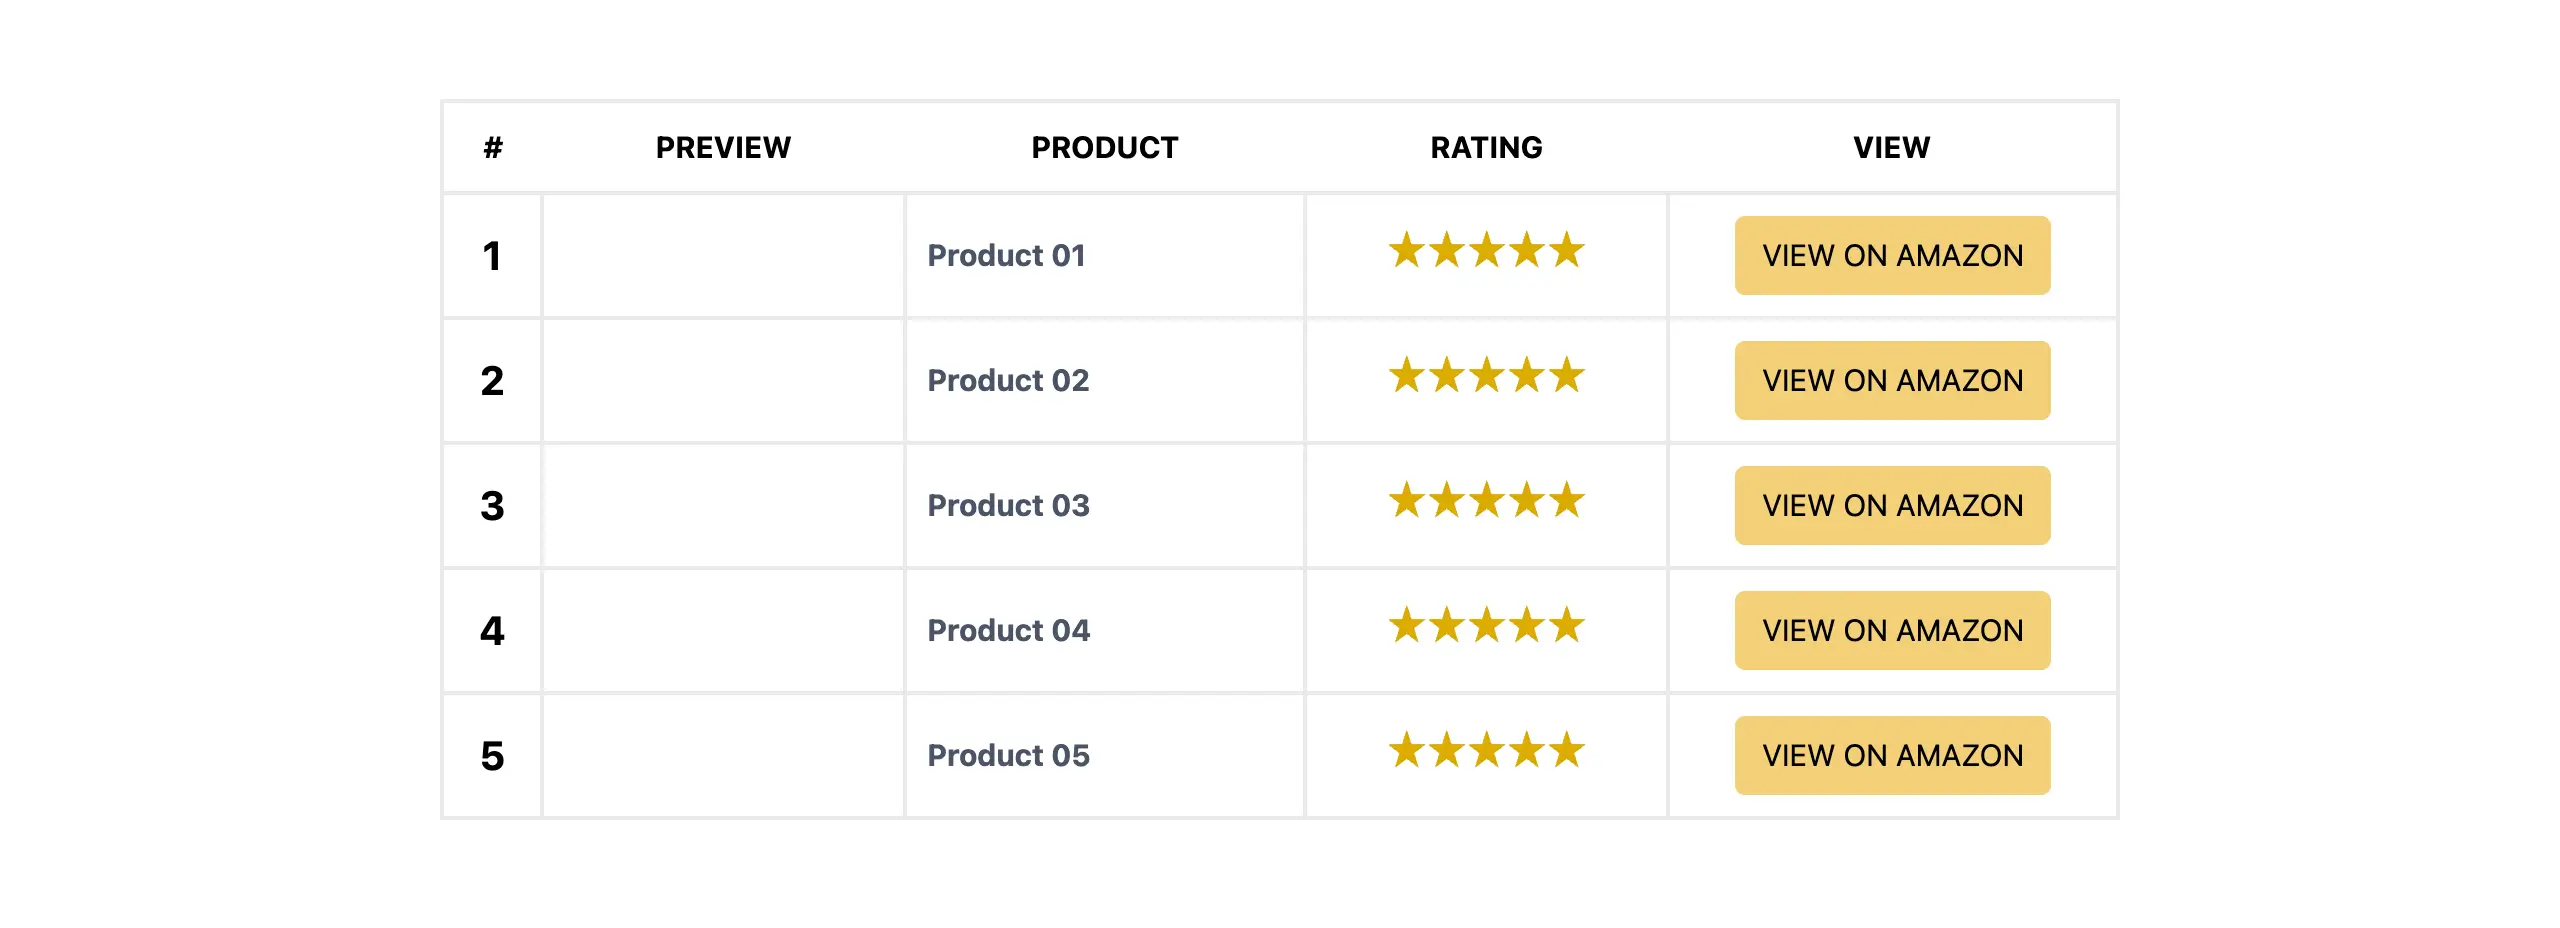
Type 02. Pricing and Plan Comparison Tables
A pricing and plan comparison table aligns cost, limits, and features across different plans. Plans are placed in rows or columns. Key details like price, user limits, and storage are displayed in structured cells.
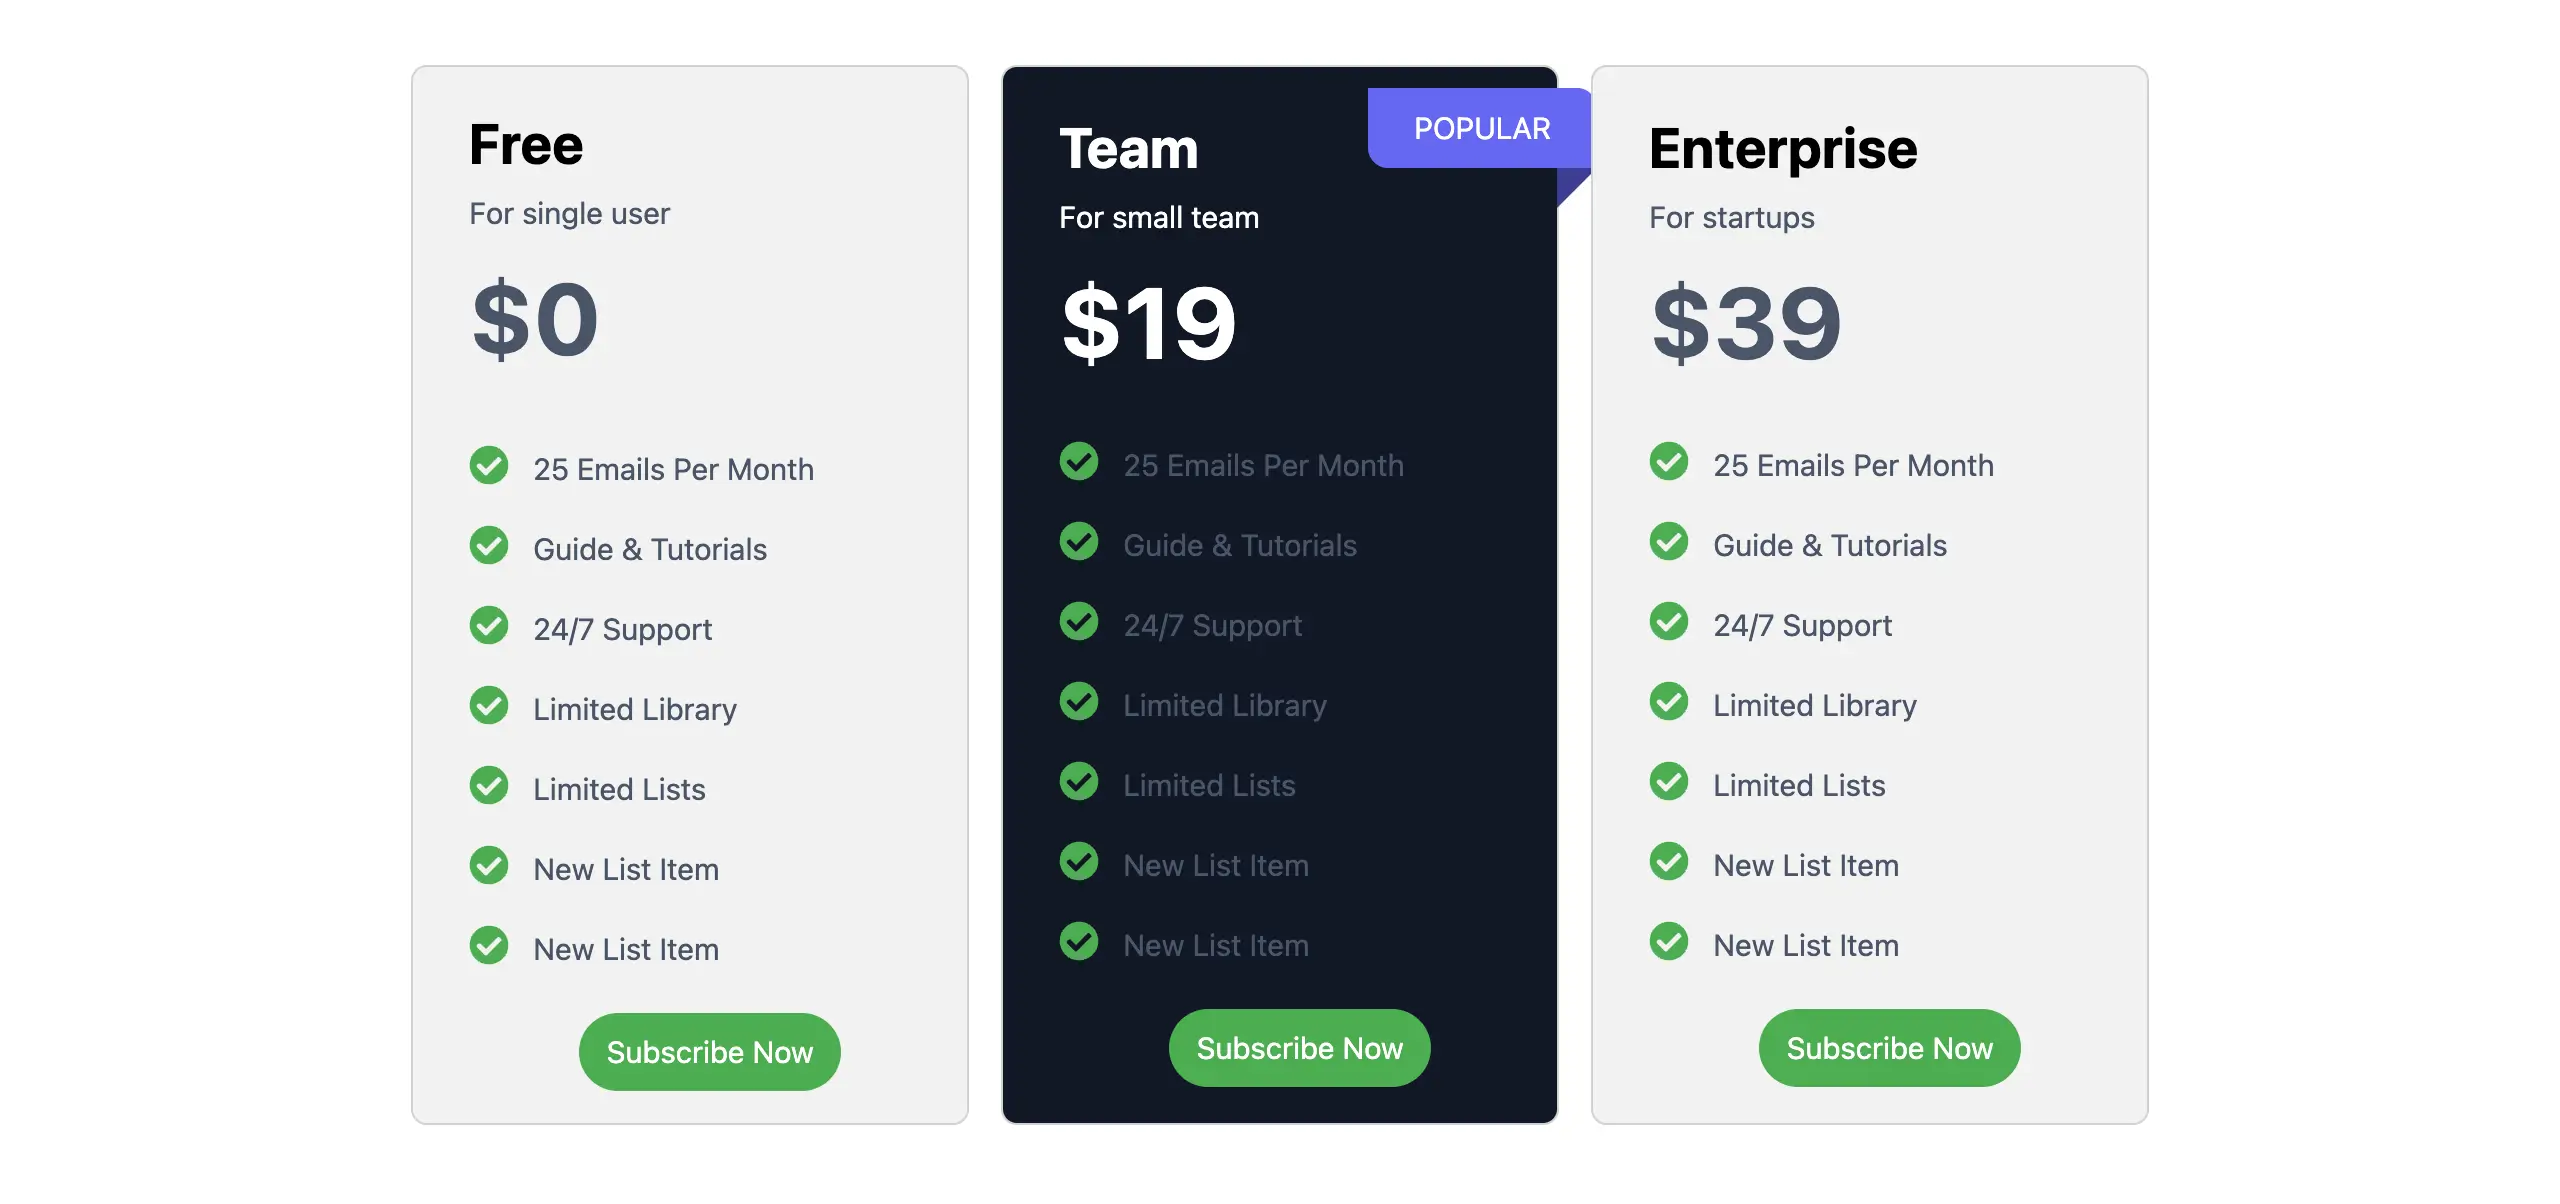
This format is best for:
- SaaS pricing pages
- Subscription-based products
- Tiered service comparisons
It clearly shows:
- Price differences
- Upgrade value
- Feature limits per plan
Numbers are easy for AI systems to extract. When pricing and limits are structured inside a table, tools like Google AI Overviews can reuse them more confidently. There is less risk of misinterpreting conditional language.
Type 03. Categorization Tables
A categorization table groups tools or products based on a specific use case. Instead of comparing everything at once, it answers one focused question.
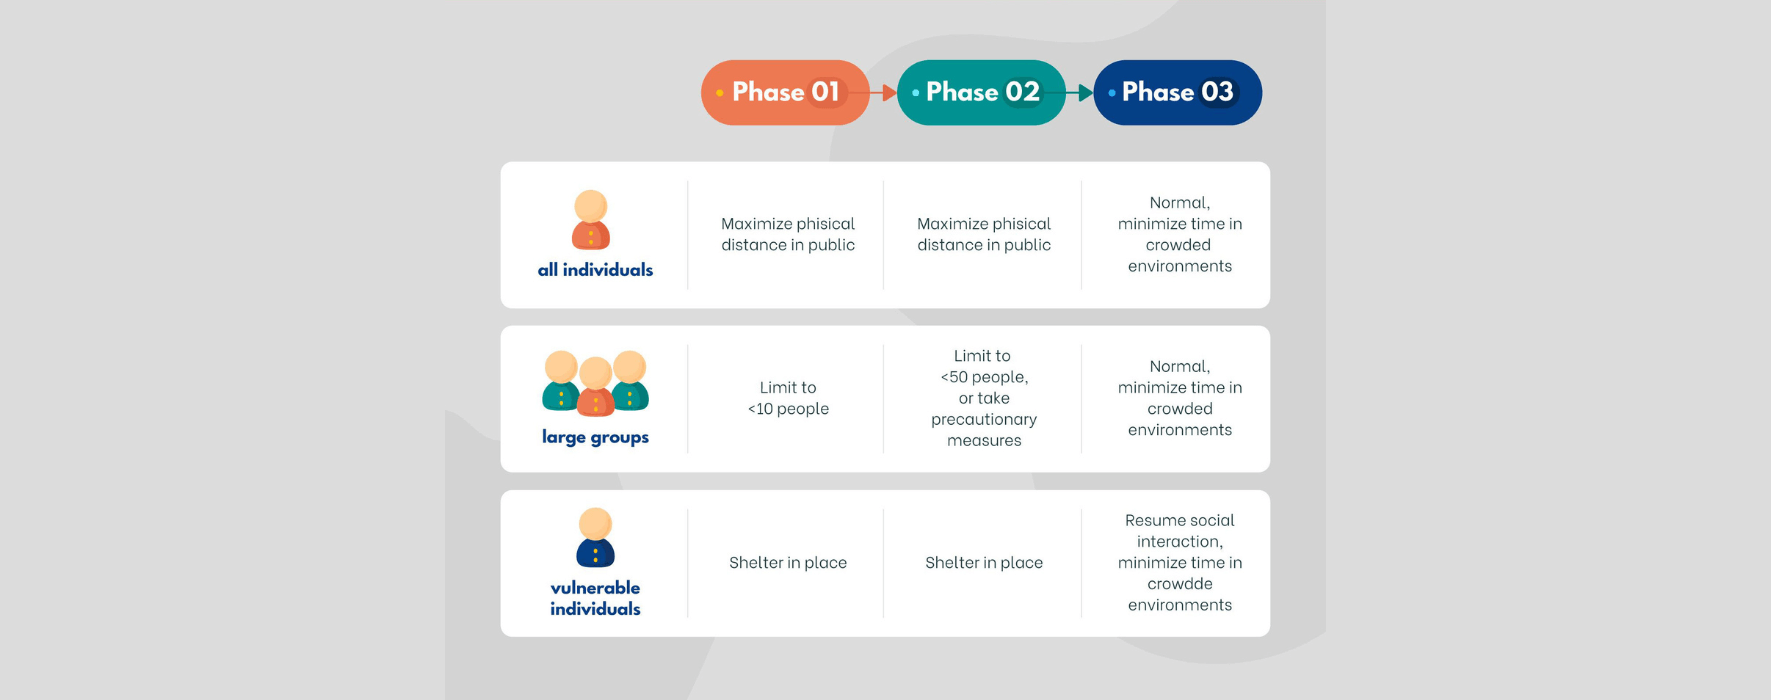
This format is best for:
- Showing values to beginners
- Recommended for WooCommerce lists
- Use-case-based blog posts
It clearly shows:
- Which option fits which audience
- The intended purpose of each tool
- The scope of the comparison
By narrowing the comparison, this table reduces ambiguity. AI systems do not need to decide who a tool is for. The grouping already defines that relationship.
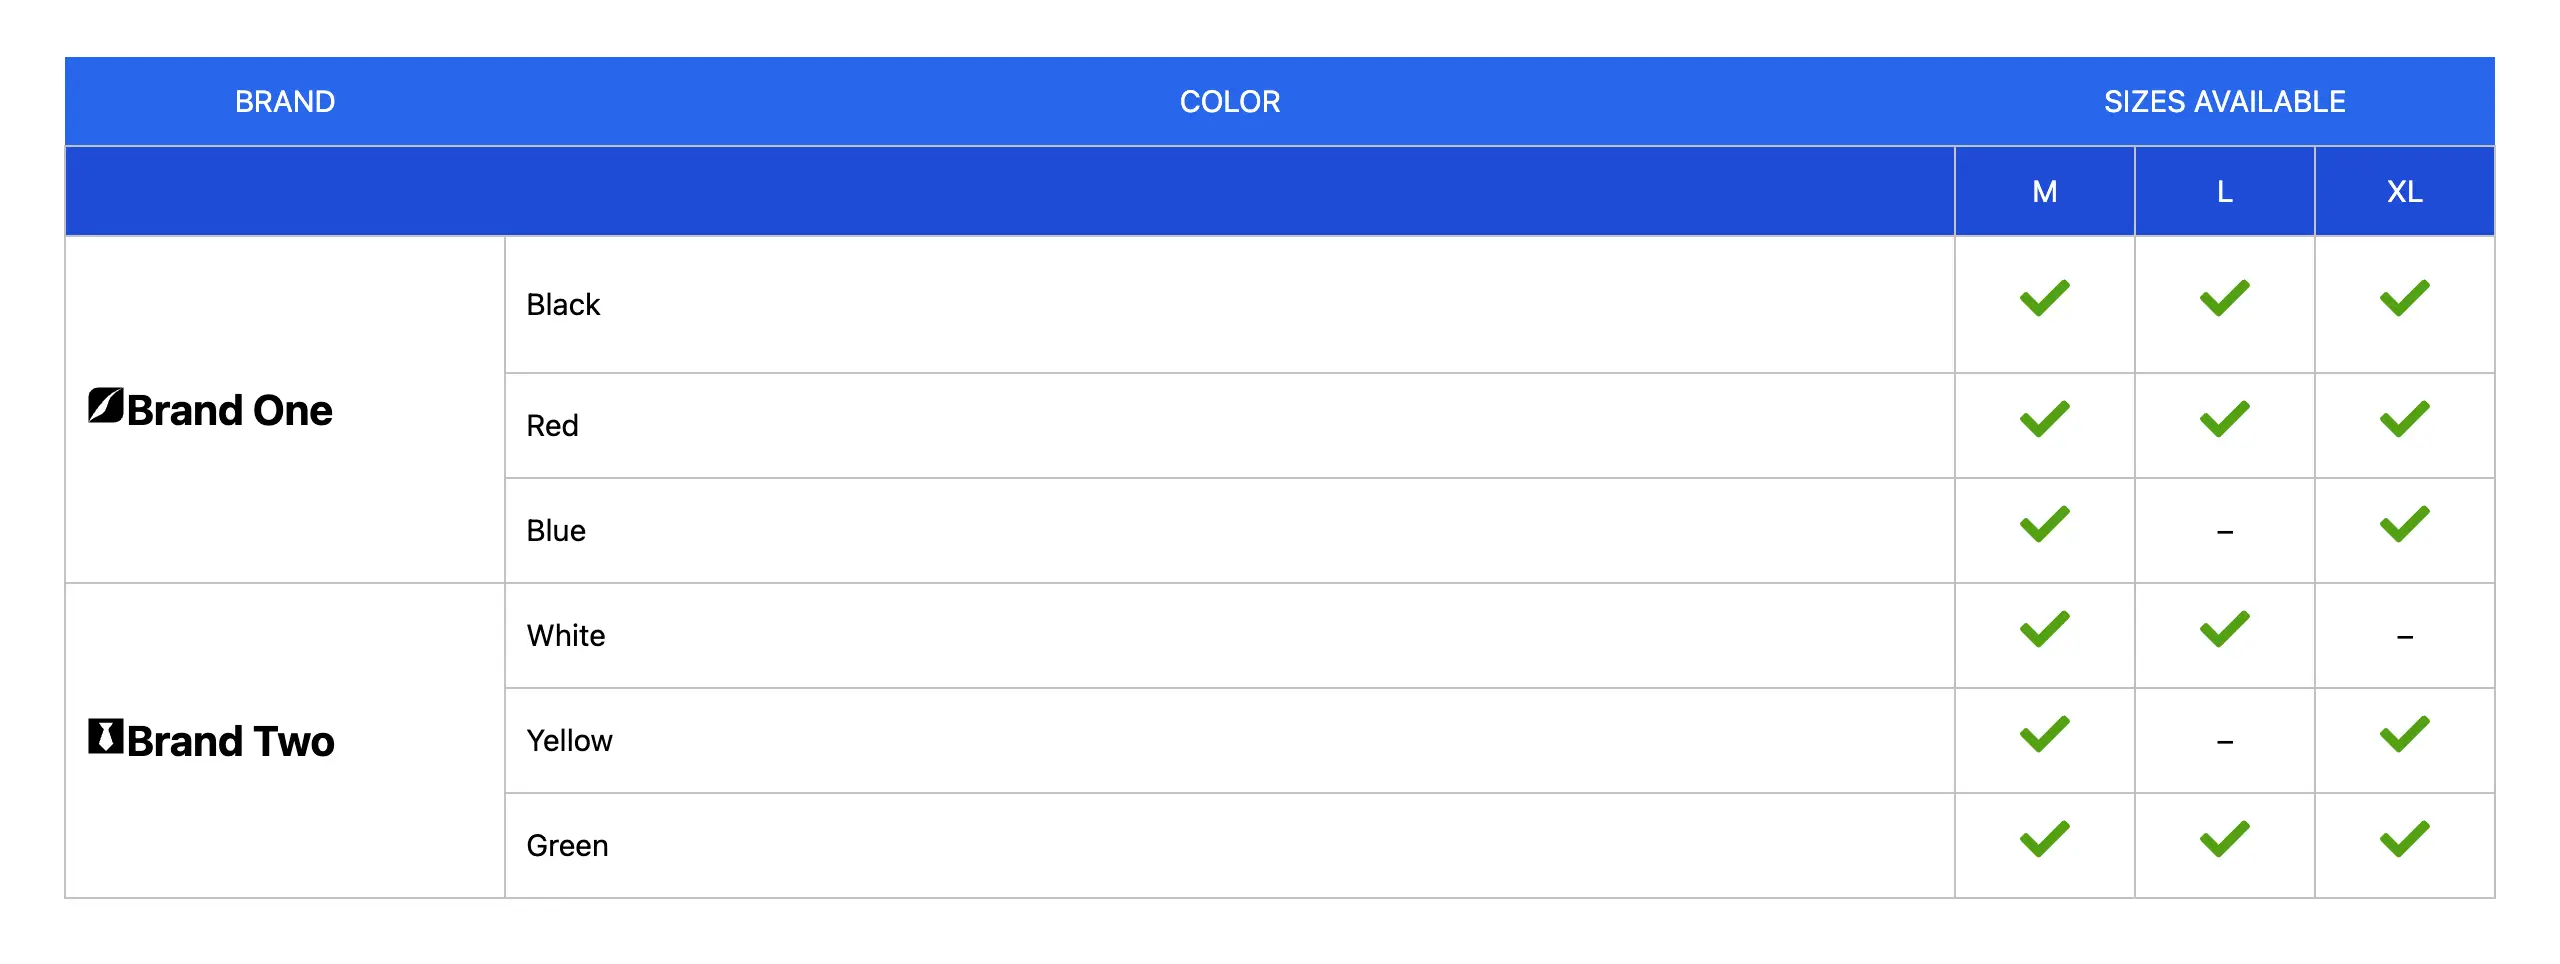
Type 04. Specification and Limit Tables
A specification and limit table focuses only on measurable data. It lists technical limits, compatibility details, and supported formats in a structured way.
This format is best for:
- Storage limits
- User caps
- File size restrictions
- Compatibility lists
It clearly shows:
- Exact numbers
- Supported formats
- Defined technical boundaries
These tables are extremely AI-friendly because numbers and limits are precise. There is little room for interpretation. When information is numeric and structured, extraction becomes more accurate.
How to Combine Tables With Text (The Right Way)
Tables are indeed powerful. But still, there is no way that you can fully replace all types of text discussions with tables. It does not explain why those facts matter. If you only add tables without context, your post may feel incomplete. So, you should combine tables with texts.
The best structure is simple and repeatable. It includes a short intro paragraph, a table, and a human explanation below. Let’s break this down.
Step 1: Start With a Short Intro Paragraph
Before showing a table, briefly explain what the reader is about to see. Define the scope of the comparison. Clarify who the table is for. For example,
Below is a comparison of the most important features between the Free and Pro versions.
This helps both readers and AI systems understand the purpose of the table. It sets boundaries. It tells the model what question the table answers.
Step 2: Present the Table
Now you show the structured data. This is where AI systems will extract structured relationships. Therefore, each row and column defines meaning clearly. There is little room for confusion. The table should include the following things.
- Use clear column names
- Avoid vague labels
- Keep values factual
- Stay focused on one comparison goal
Step 3: Add Human Explanation Below
After the table, explain what matters. This is where nuance belongs. AI systems get the structured facts from the table. Humans get interpretation and guidance from the explanation. You can discuss the following points in the explanation:
- Which option is best for beginners
- When upgrading makes sense
- Important limitations
- Edge cases, the table does not show
Common Mistakes That Reduce LLM Friendliness
Tables improve clarity, but only when they are structured properly. However, there are many mistakes people often make that remarkably degrade the quality of the table design, which is why AI systems may struggle to extract accurate relationships. Let’s take a look at them below.
1. Overloaded with Too Much Information
Trying to place all features, plans, use cases, and limits into one large table usually creates overload. When too many attributes are mixed together, the purpose of the comparison becomes unclear. Smaller, focused tables are safer and easier to extract from.
2. Inconsistent Column Names
If you don’t follow a logical order to label your columns, it will create confusion. For example, using ‘Price’ and ‘Cost’ as names to label your columns in the same table may look harmless, but this weakens the logical consistency. AI systems rely a lot on pattern recognition
3. Putting Opinions in Tables
Tables should contain factual values, not subjective opinions. Writing ‘Excellent,’ ‘Best choice,’ or ‘Very powerful’ inside a cell introduces ambiguity. These words are interpretive, not measurable. AI systems prefer clear values like ‘Yes,’ ‘No,’ numbers, or defined feature names. Check how to make a responsive table on WordPress.
4. Hiding Important Details
If critical details are placed in small footnotes instead of inside the table, the structure becomes incomplete. For example, listing ‘Unlimited Users’ and explaining the limit in a footnote creates risk. Important limits and restrictions should be visible directly in the main table cells.
5. Using Images Instead of Real HTML Tables for Data
Turning a table into an image may look visually appealing, but it reduces machine readability. AI systems and search engines can easily parse real HTML tables. They cannot reliably extract structured data from static images. So, always use real HTML tables for clarity.
Why WordPress Tables Are a Natural Fit

WordPress is currently the most popular content management system online. It already works in a way that supports structured content. It uses clean HTML. That means when you create proper tables inside WordPress, you are not fighting the system. You are working with it.
Because WordPress outputs standard HTML, tables created inside the editor remain readable in the source code. AI systems and search engines can scan them easily. There is no need for a complex schema or custom markup just to make comparisons clear.
So, if we sum up everything:
- WordPress is text-first and outputs clean HTML
- Tables remain crawlable and machine-readable by default
- No custom markup is required for structured comparisons
- They help maintain a consistent structure
A simple, well-structured HTML table is already machine-friendly. So, if you can use them correctly, you create content that is readable for humans and easy to process for AI systems at the same time.
Best WordPress Table Builder Plugins
WordPress has a default table block. But this block is useful only for basic-level usecases. When it comes to creating complex tables with various types of data, you definitely need custom plugins. Below, we’ve discussed two great table builder plugins. Check them:
WP Table Builder
WP Table Builder is a drag-and-drop table builder designed for flexibility and simplicity. It makes it easy to create structured tables that clearly separate entities and attributes. You can build comparison tables, pricing tables, and specification tables without worrying about messy HTML.
Its clean structure ensures that AI systems can easily read rows and columns, while humans can scan tables quickly for the information they need. If you love the drag-and-drop feature, this plugin will really be a great choice for you.
Key Features of WP Table Builder:
- Drag-and-drop table editor
- Support for feature comparison, pricing, and specification tables
- Merge cells and customize layouts easily
- Responsive and mobile-friendly tables
- Clean HTML output for AI-friendly extraction
- Supports images, icons, HTML, buttons, ribbons, and more
Tableberg
Tableberg is another powerful table builder focused on simplicity and readability. It’s built for the Gutenberg block editor. It allows you to create clear, structured tables. This makes your tables easy for AI systems to extract and summarize while remaining visually accessible for readers.
Tableberg is especially useful for categorized tables, pricing comparisons, and specification charts, ensuring your posts stay organized and LLM-friendly. If you don’t love drag-and-drop and prefer a block-based solution, Tableberg will be the nicest option for you.
Key Features of Tableberg:
- Simple and intuitive table editor
- Ready-made templates for comparisons and pricing tables
- Customizable rows, columns, and cell formatting
- Supports categorization and grouping for better clarity
- Clean, semantic HTML output for AI systems
- Supports images, buttons, icons, styled lists, ribbons, and more
Final Thoughts: Clarity Wins for Humans and AI
Tables do not make your content LLM-friendly by magic. They work because they improve structure. They separate entities from attributes. They align features with plans. They turn mixed paragraphs into clear relationships. When everything perfectly blends, AI systems can extract them with more confidence.
Hope this post has improved your knowledge base. Now, it’s your time to create wonderful and easy-to-read tables on WordPress and increase the visibility of your content both on the AI system and SERPs right away. Comment below if you hae any question.
Leave a Reply
You must be logged in to post a comment.