

A comparison table has one job: help someone choose. When it works, a visitor can look at a few columns and know which option suits them. When it does not, they see a wall of checkmarks, give up and leave to read another review.
The difference usually comes down to a handful of decisions about what to include and how to lay it out. This guide covers 10 comparison table best practices you can apply to product, plan and feature comparisons, followed by a live example and the steps to build one in WordPress.
What Is a Comparison Table?
A comparison table puts several options side by side so people can check the same details for each one. Most of them list the options across the top and the features down the side, so the reader can move along a row and see how each option handles that feature.
You will find them on pricing pages, product reviews, affiliate roundups, software feature pages and buying guides. They are most useful when a choice involves several factors and the options are close enough that the differences are hard to remember.
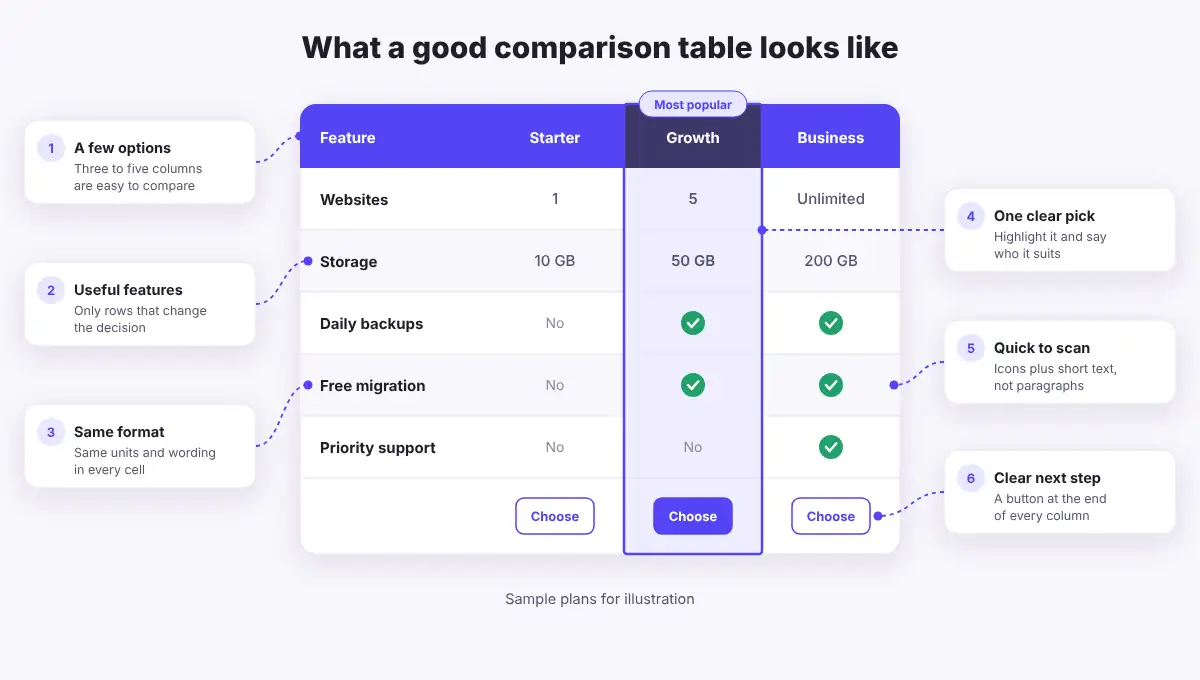
10 Comparison Table Best Practices
You do not need to apply every tip to every table. Start with the first five, since they decide what goes into the table, then use the rest to make it easier to read and act on.
1. Start With the Decision Your Reader Is Making
Before you add a single row, write down the question the table should answer. “Which hosting plan fits a small store?” leads to a very different table than “Which host is the fastest?” That question tells you which options belong and which details matter.
2. Compare a Small Number of Options
Three to five options is a good target. People struggle to hold more than that in mind, and extra columns get narrow quickly. If you have more to cover, group them into separate tables by budget, use case or category, or link to a full roundup.
3. Include Only Features That Affect the Choice
A long feature list looks thorough, but it hides what matters. Keep the rows that could change someone’s mind and put the most important ones first. If every option has a feature, you can usually drop it, unless readers specifically expect to see it confirmed.
4. Use the Same Format in Every Cell
Comparison only works when values match. Use the same units, the same wording and the same level of detail across a row. Write “50 GB” for each option instead of mixing “50 GB”, “50,000 MB” and “plenty”. Never leave a cell empty, because readers cannot tell whether the answer is “no” or “we did not check”. Write “No” or “Not included” instead.
5. Make the Table Easy to Scan
Put options in columns and features in rows, keep cell text short and align similar content the same way. Striped rows help the eye follow a line across the table. Use checkmarks for quick yes or no answers, but pair them with a word such as “Yes” so the meaning does not rely on color or an icon alone.
6. Highlight One Recommendation and Explain It
Many readers want to know which option you would choose. Make one column stand out with a stronger header, a soft background or a short label like “Most popular” or “Best for beginners”. Then say why in a sentence near the table. Keep it honest: a label only helps if it matches what the table shows.
7. Keep Labels in View on Long Tables
When a table runs past one screen, readers forget which column is which. Sticky header rows and first columns solve this. If you cannot use sticky rows, split a long table into smaller groups, such as “Features” and “Support”, and repeat the option names at the top of each one.
8. Plan the Mobile Version
A wide table is hard to read on a phone. Decide how yours should behave on small screens: stack it, hide less important columns, or let it scroll sideways. Stacking suits most comparison tables with short values. Our guide on how to create responsive tables in WordPress explains each option.
9. End With a Clear Next Step
Once someone has decided, make the next action easy. Add a button at the bottom of each column with a specific label such as “See plans” or “Download”. On long tables, a button near the top helps people who already know what they want.
10. Keep the Information Accurate
Prices, limits and features change. An outdated table costs you trust the moment a reader spots the mismatch. Check your tables on a schedule, update them when a product changes and use sources you can confirm, such as the official product page.
A Comparison Table Example
Here is a live table that follows these tips. It compares the default WordPress Table block with the free and Pro versions of WP Table Builder. It has three options, short values, a highlighted column and a clear action at the end.
Feature | Table block | Builder Free | Builder Pro |
Best for | Simple text | Designed tables | Long tables |
Drag and drop elements | No | ✓ Yes | ✓ Yes |
Buttons and star ratings | No | ✓ Yes | ✓ Yes |
Stacked mobile layout | No | ✓ Yes | ✓ Yes |
CSV import | No | ✓ Yes | ✓ Yes |
Highlight a column | No | No | ✓ Yes |
Sticky rows and columns | No | No | ✓ Yes |
Get it | Built in |
The Table block is fine for simple text. Once you need buttons, ratings or a stacked phone layout, a plugin saves a lot of work. See how to create tables in the block editor if you want to compare the two approaches.
How to Build a Comparison Table in WordPress
You can build this kind of table with WP Table Builder without writing code. These steps use the free plugin, and we note where a feature needs Pro.
- In your dashboard, go to Plugins > Add New, search for WP Table Builder, then install and activate it.
- Go to Table Builder > Add New. Pick a template from the Comparison category, or set the number of columns and rows and click Create table.
- Give the table a clear name in the top bar so you can find it later.
- Open the Elements tab and drag Text into the header and feature cells. Add Star Rating, Image or List elements where they help.
- Drag a Button into the last row of each option column and set its link.
- Open the Settings tab. Set Header Background, Odd Row Background and Even Row Background, then add rounded corners with Table Border Radius.
- Open the Responsive tab and switch on Enable Responsive Table. Choose a stack direction for the Tablet and Mobile breakpoints and keep the first row as a header.
- Click Save, then Embed. Add the table to a page with the Table Builder block or its shortcode.
To make one option stand out in the free version, give its header a stronger label and use a solid button color for that column only. With Pro, you can turn on Highlight this column or set a background for individual cells.
For a full walkthrough, see how to create a feature comparison table or our guide to a product comparison table in WordPress. New to the plugin? Start with the drag and drop builder guide.
Best Practices and Where to Find Them in WP Table Builder
Use this as a quick reference while you build:
Best practice | Setting or element | Plan |
Striped rows | Odd Row and Even Row Background | Free |
Rounded corners | Table Border Radius | Free |
Clear next step | Button element | Free |
Ratings at a glance | Star Rating element | Free |
Mobile layout | Enable Responsive Table | Free |
Fewer columns on phones | Hide this column on mobile | Free |
Visitor sorting | Sort Table Vertically | Free |
One clear pick | Highlight this column | PRO |
Labels stay in view | Make Row Sticky | PRO |
Attention labels | Badge and Ribbon elements | PRO |
Common Comparison Table Mistakes to Avoid
- Too many options: ten narrow columns are harder to use than two focused tables.
- Marketing language in cells: “Amazing support” tells readers nothing. “24/7 live chat” does.
- Unfair rows: listing only the features your favorite option wins makes the table feel like an advert.
- Hidden conditions: if a feature has a limit, say so in the cell or a short note.
- No mobile check: always open the finished table on a real phone.
Frequently Asked Questions
How many items should a comparison table have?
Three to five options works well for most tables. You can go higher when options are simple, but consider splitting them into groups so the columns stay readable, especially on phones.
Should options go in columns or rows?
Options usually work best as columns and features as rows, because people can read across a row to compare one feature. If you have many options and only a few features, the reverse can be easier to read.
How do I make a comparison table work on mobile?
Stack the table, hide columns that are not essential or allow horizontal scrolling. In WP Table Builder, the Responsive tab lets you set separate tablet and mobile layouts, and these settings are included in the free plugin.
Can I highlight a column in WP Table Builder?
Yes. Highlight this column and per cell backgrounds are part of WP Table Builder Pro. In the free plugin, you can draw attention to an option with a stronger label and a solid button.
Does a comparison table help SEO?
A clear table can make a page more useful and easier for search engines to understand, but it does not guarantee better rankings. Add a descriptive heading, explain the table in the text around it and use alt text on any images.
Conclusion
A good comparison table is built around the reader’s decision. Keep the options few, the rows relevant and the values consistent, then make it easy to scan, easy to read on a phone and easy to act on.
If you want to try these ideas, WP Table Builder lets you build a responsive comparison table with drag and drop, and the free version covers most of what you need. For more ideas, read our pricing table optimization tips or browse the best WordPress comparison table plugins.
Leave a Reply
You must be logged in to post a comment.